A month or so after the birth of our daughter, Sarah and I noticed that when she wasn’t snoozing or snacking, she was almost-invariably voicing her discontent. “It’s colic,” our pediatrician advised us on an early visit. It was a term I’d heard but hadn’t really internalized, so I prodded for more information.
“Usually babies cry for very specific, understandable reasons,” our doctor explained. “They have a dirty diaper, they’re uncomfortable, they’re hungry, they’re sick, they’re in pain. If you’ve checked all these things and none of them need addressing, it’s tough to tell what’s making them sad.” The doctor shrugged. “Maybe she’s upset about Trump, or the drought, or the prospect of entering the real estate market in the Bay Area. Who knows? The takeaway is that there’s not much you can do to comfort her, and so the prescription here is for you two, not her.” Our orders were to try to remain supportive and sensitive to each other, and to realize colic is a game of stamina more than anything else.
Around this time, I stumbled across a super-interesting project by an artist in New York: a miniature indoor thunder cloud that incorporated sound and light. “Holy shit, I want one,” I thought; it’d make a kickass and apropos mobile for my stormy-attituded daughter.

Interestingly, the artist provided some pretty transparent documentation about the process of building the piece, which led me to wonder if I could make one myself. I’ve often wanted an excuse to build something powered by an Arduino, but never really had an idea I felt was worth pursuing. Spurred on by a whole heap of new thoughts and emotions that come with transforming from Not A Dad into A Dad, I decided to give it a shot.
My original idea for Miramar’s cloud was to make something that could detect sound and trigger a ‘thunderstorm’. This immediately defined some requirements: I needed a way to detect sound, a way to generate sound, and a way to generate light. I considered briefly a variety of different platforms to work with (Raspberry Pi, Arduino offshoots, etc) before ultimately deciding to go the Arduino route because 1) I didn’t want to deal with long boot times and 2) I didn’t want to risk getting sidelined by a development hornet’s nest (which is to say: I wanted this project to be about building this pretty thing, not about figuring out library compatibilities and driver versions and arcane compilation issues).
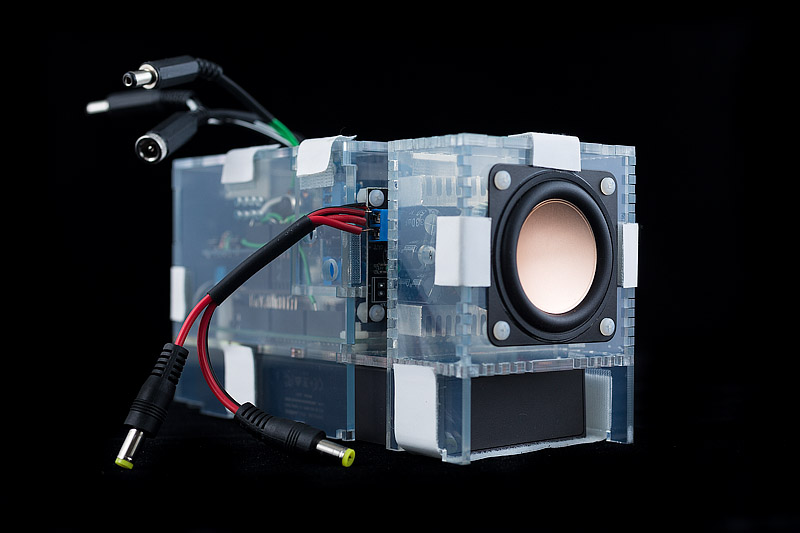
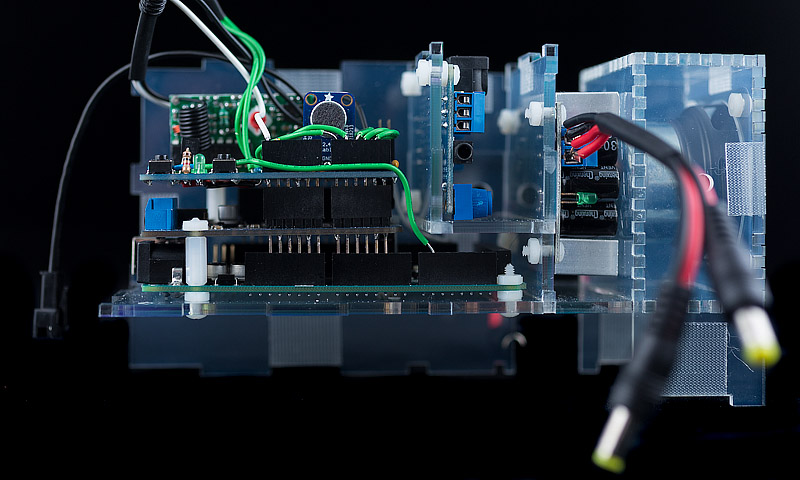
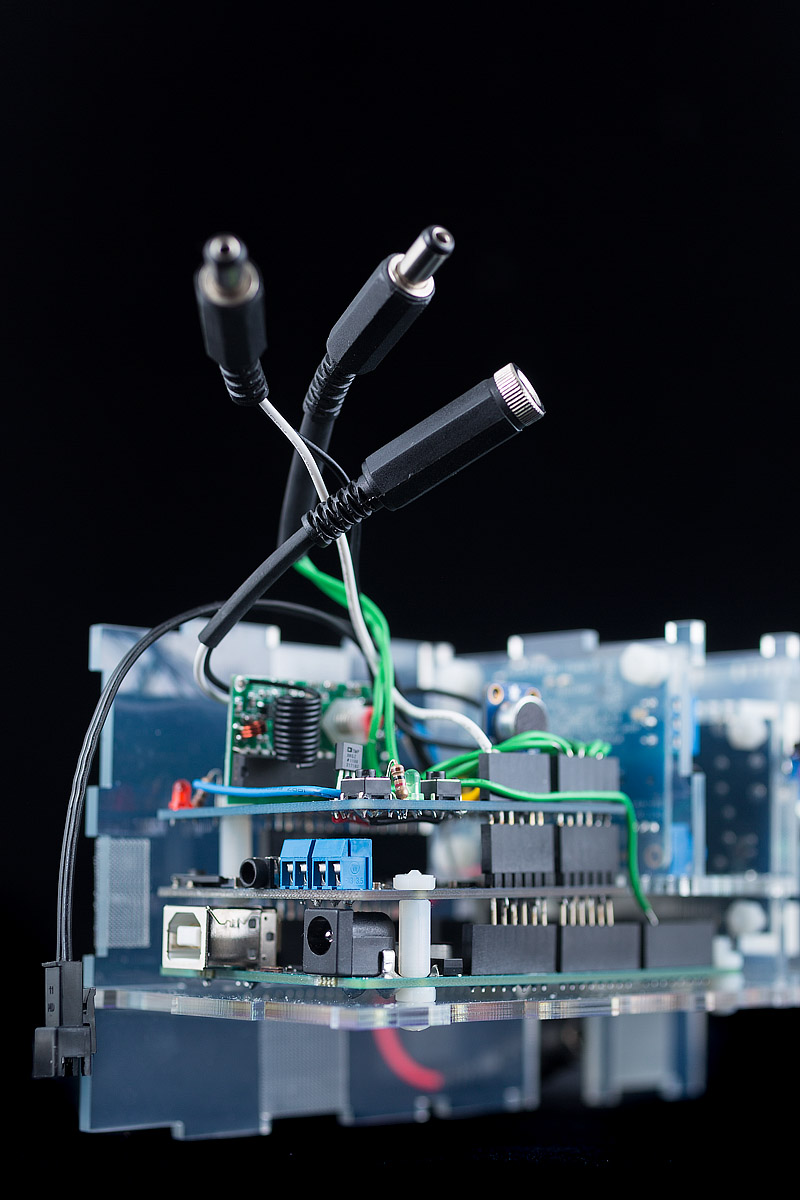
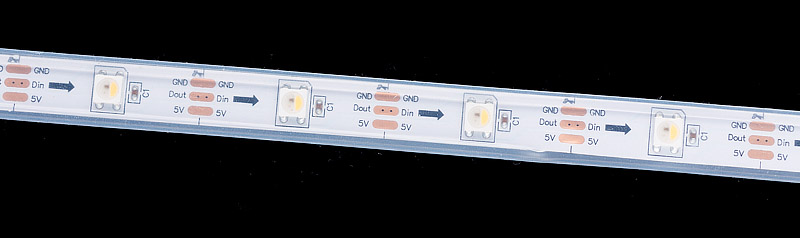
After about a few weeks of coming up to speed on Arduino and the various shields and boards one can find for it on sites like Sparkfun and Adafruit, I had a rough version of the cloud innards barely up and running. I’d chosen Adafruits NeoPixels as my light source because they seemed well-documented, tidily-packaged, and easy to communicate with, and had successfully built a functioning circuit involving an Arduino Uno board, a small microphone/amp and a tiny 3w speaker. I could ‘listen’ to audio, and could trigger lights.
It turns out, though, that simply listening for ‘some sound’ is not helpful. My cloud could trigger itself not only at Miramar’s cry, but at a passing motorcycle or a garbage truck emptying the dumpster behind our apartment way too early every frigging Tuesday morning. I needed to be able to identify specific sounds.
The fancy term for this is FFT frequency spectrum analysis. Worded simply: you can run a given snippet of sound through FFT analysis and get back some number of “buckets”, where each bucket contains the amount of a particular frequency in that sound snippet. So, e.g., you can say “here’s 1 second of sound; please tell me how much of these (say) 8 frequencies exist in this sound.” (In this example, I’m asking for 8 frequency buckets.) You can then do interesting things with these ‘buckets’.
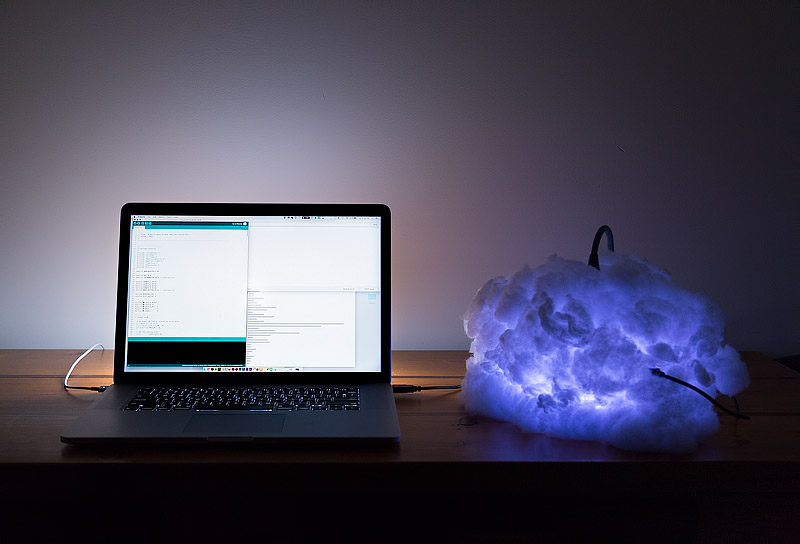
Here’s a more visual example. Using some sound-processing software called Abelton (thanks Mike), I can visualize up to 2048 frequency buckets of audio ‘heard’ by the microphone on my laptop. If I sit next to Miramar and wait for her to cry, the buckets (‘spectrum’) look like this:

On the left are low frequencies, and on the right are very high ones (nerd note: this graph is presented logarithmically). The vertical height of the graph represents “how much” of a given frequency exists in the sound the microphone currently hears. You may have seen graphs like this in old-school music visualizers like Winamp back in the day; if you’re more the visual type, RGB histograms for images are exactly this same concept, only instead of ‘amount of sound’ you’re examining ‘amount of color’.
ANYWAY. Notice the little spiky bits near the left. Those spikes went high each time Miramar breathed in and let out a cry. The graph is telling me that there’s a lot of those particular frequencies in her cry; if I could reliably identify those frequencies on my cloud, I could theoretically trigger things based only on those frequencies.
I wrote a small bit of code on the Arduino to gather a snippet of sound from the microphone, run an FFT analysis on it, and just print the result. I held the circuit near Miramar while also watching the Abelton graph on my laptop, and tried to see if I could find some correspondence between the two. The Abelton FFT offers WAY more buckets (because my latop is way more powerful than the Arduino); the Uno board only really had enough memory for about 32 buckets, which was a far coarser resolution. Nevertheless, when I held the board near Miramar when she cried, I could see some similar spiking:
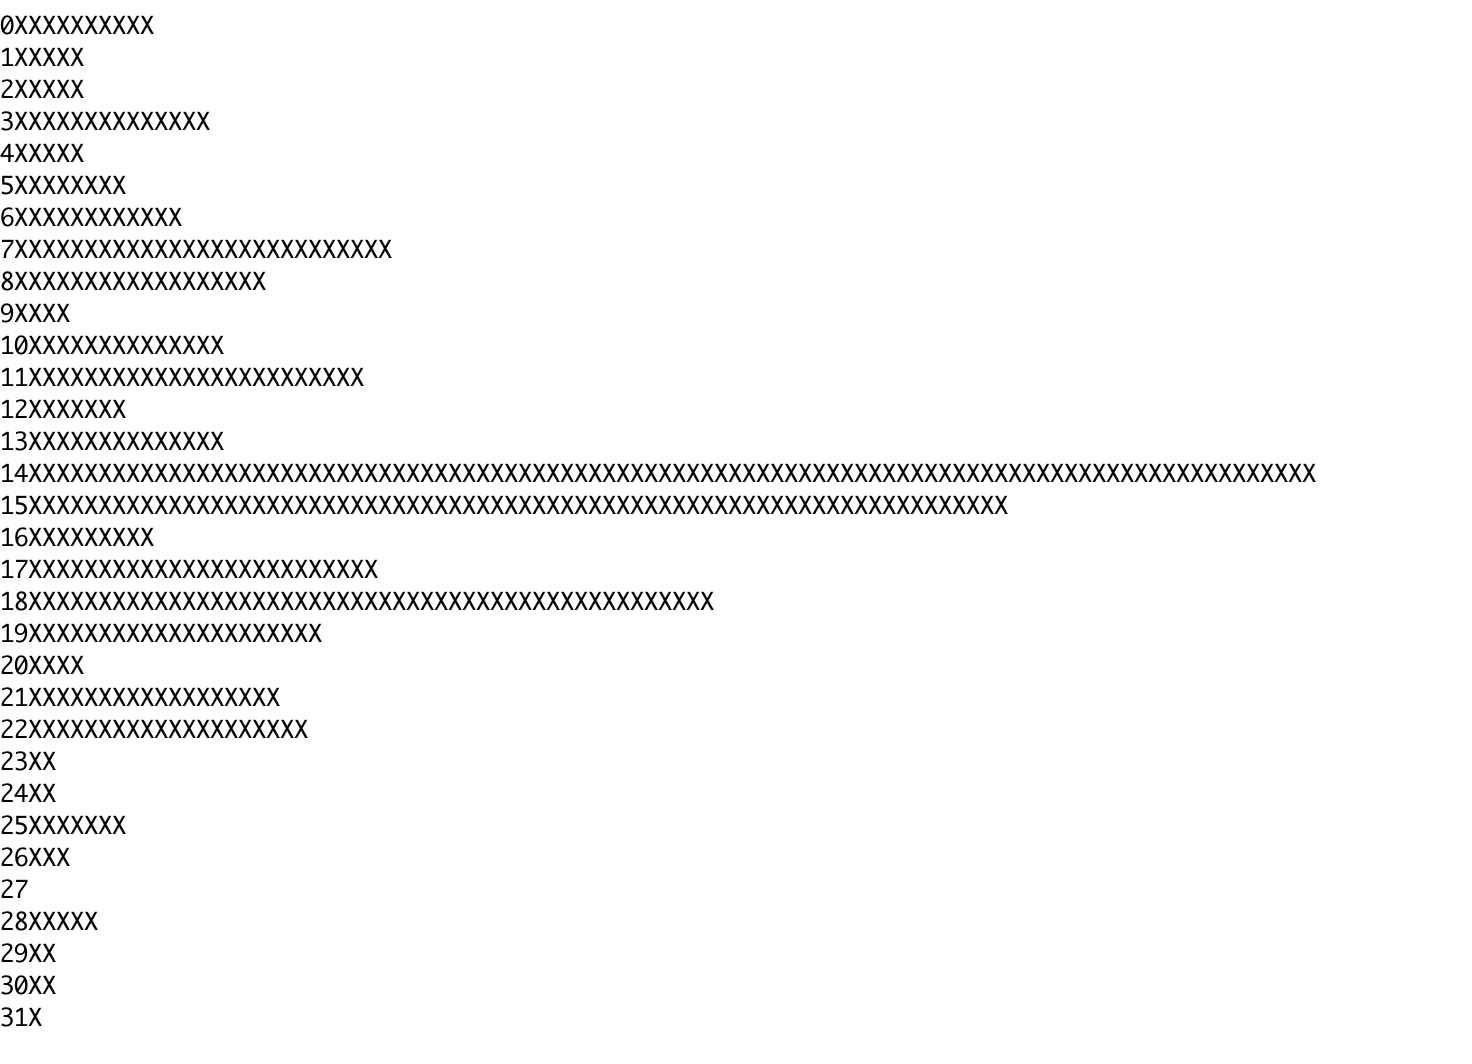
The above image is sort of like a lower-resolution version of the Abelton graph above, turned on its side. At the top are low-frequency sounds; at the bottom are high frequencies. While way more coarse, I could still see a unique enough spike to reassure me that this path was promising.
Miramar’s cry fluctuates a bit. It’s a little like pressing your fingerprint onto a surface; while it’s always your fingerprint, it changes slightly based on angle of attack, how hard you press, how oily your finger is, etc. Miramar’s cry similarly fluctuates based on her breathing, whether she’s on her side or her back, etc. So I needed to come up with some sort of “average cry” fingerprint for her.
I wrote another program for the Uno that would listen to her cry, but would throw out ‘silences’ (samples where her primary buckets went low, which was when she breathed in between cries), and average the result. This is Terrific Parenting 101: get excited when your kid cries, sit next to them with a laptop tethered to a mess of cables and electronics circuitry, DO NOT attempt to comfort them or your data is invalidated. But in the end:
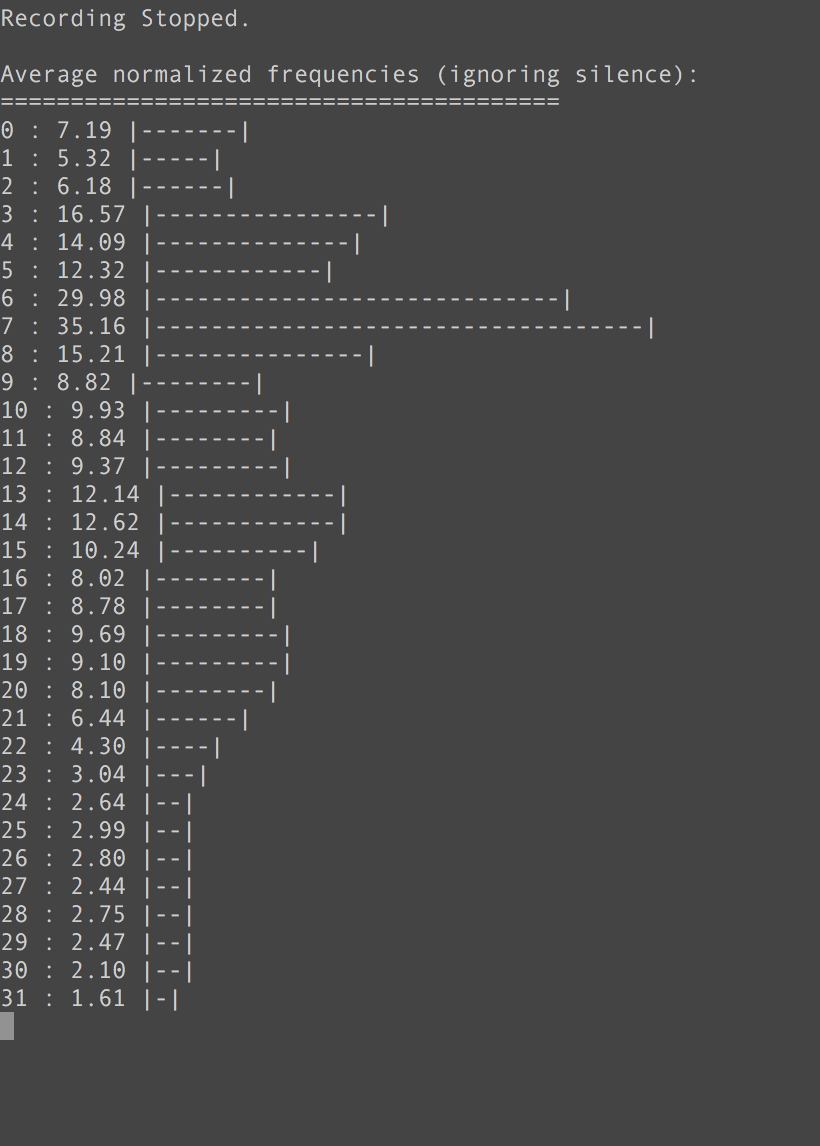
Totes worth it. I had a pretty decent ‘vocal fingerprint’ for Miramar.
A problem I ran into at this point was that my Arduino board could listen to audio and process the FFT, OR it could trigger lights…but it didn’t have the processing power or memory capacity to reliably do both. After a few weeks of stumbling down a path of optimizing my code, I realized that I needed to either drop down to even less FFT resolution OR explore other microprocessors that offered more memory. I had a brief adventure with the very-alluring Arduino 101 (built-in accelerometer/bluetooth, gobs of memory), but quickly ran into weird compilation problems with the board. Apparently it’s so new that people are still trying to figure out how to even make it go. I decided I didn’t want to get lost in that, and instead tried an Arduino Mega. While notably bigger in form factor, this board turned out to have plenty of memory, so much so in fact that I could request up to 64 frequency buckets with the FFT code with no problems. More = better.